Intelligent Traffic Systems – Traffic Signal Timing Optimization: Notes and Recap

Intelligent Traffic Systems – Traffic Signal Timing Optimization

We started discussion with the general evolution of traffic signal and related technologies, noting that one of the deficiencies is traffic signal timing. Common traffic light optimization is retiming based on traffic statistics, leading to a fixed-timing strategy.

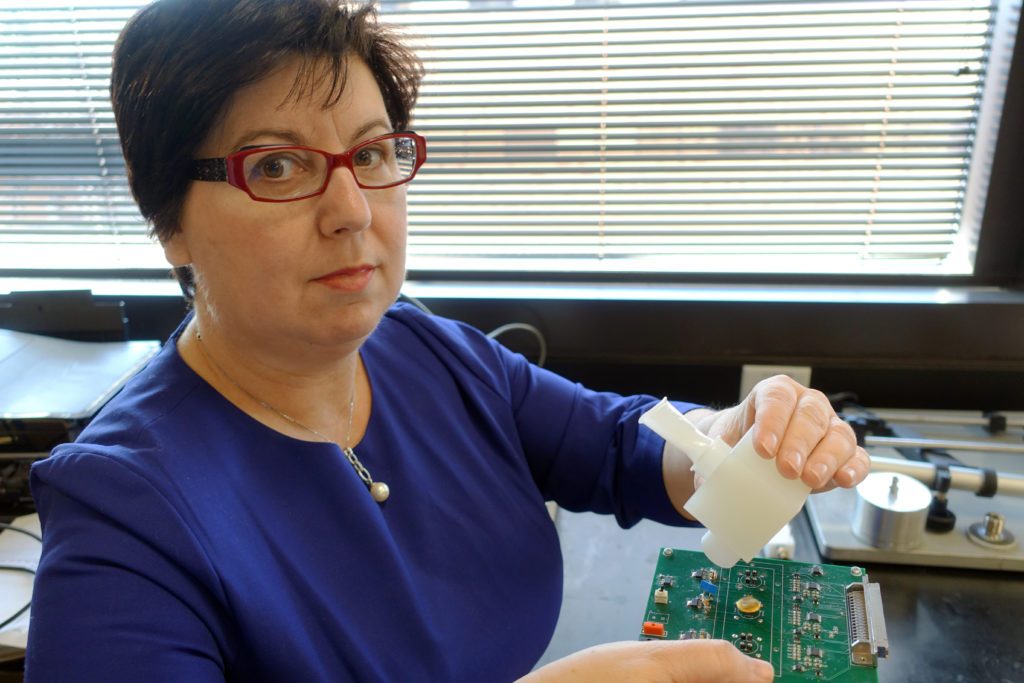
Next we heard from Professor Nicholas Gan, a professor at UTD and member of the Intelligent Traffic Systems team. His other expertise includes robotics and autonomous vehicles. You  can here recent his interviews on NPR here and here.

The UTD ITS team recently completed a primary investigation of using distributed, model-free, near real-time optimization of traffic signal timing. Simulations were run based on Dallas and Richardson intersections. The initial strategy was local optimization, where each traffic signal sought to maximize north/south and west/east traffic throughput without communication with other traffic signals (they were “greedy”). The simulation employed a function with various parameters and vehicles with randomized individual behavior. Real maps of the target intersections were imported into the simulation and the simulated traffic count was based on the inductance coils that are already at most major intersections. Monte carlo simulations were run by adjusting the fraction of time each direction is green and the vehicle throughput observed for the maximum throughput. Simulation results demonstrated approximately 5% reduction in the number of cars stopped at the intersection, which is on par to manual retiming. Possible future research includes optimization among a network of traffic intersections.

Other points of note:

  • The reduction in number of stopped vehicles was uniform across various traffic conditions. That is to say reductions were observed equally in high traffic and low traffic conditions
  • The computational and bandwidth footprint was sufficiently lean such that it is expected that a single board computer could be installed at an intersection without additional hardware
  • The simulation could support historical traffic count data as input, enabling a municipality to possibly move away from fixed timing
Smart City – Group Discussion

Smart Cities: Group Discussion

During the introduction, we started with discussion of Intel discontinuing consumer IoT prototyping boards and the recent NIST publication on lightweight cryptographic protocols.

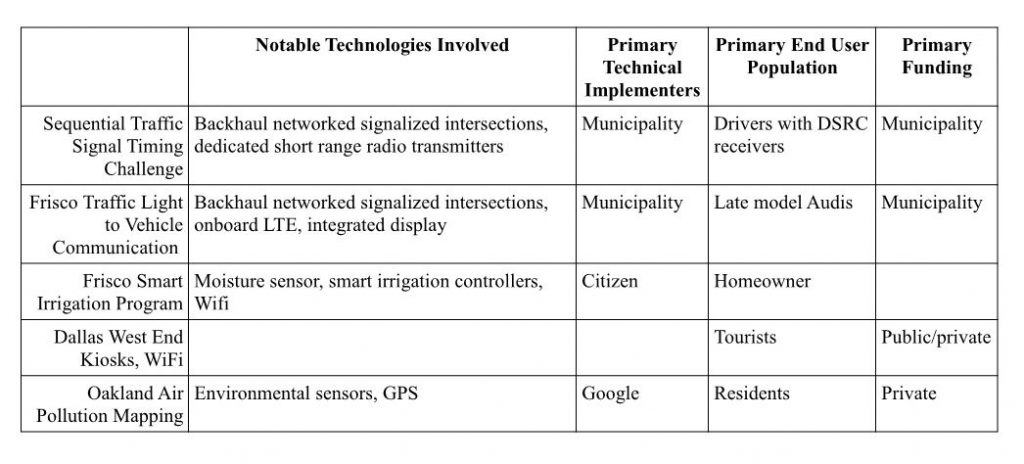
Next, we started with a brief overview of some Smart City-ish programs:
Sequential Traffic Signal Timing Challenge
Frisco Traffic Light to Vehicle Communication
Frisco Smart Irrigation Program
Dallas West End Smart Streetlights, Kiosk, and Air-Quality Sensors
Oakland Air Pollution Mapping

  1. Sequential Traffic Signal Timing Challenge (SpaT Challenge) – A program to encourage cities to implement Dedicated Short Range Communication infrastructure to vehicle messages over a coordinated corridor or network of traffic signals.
  2. Frisco Traffic Light to Vehicle Communication – Some traffic lights broadcast a countdown to green light time to vehicles.
  3. Frisco Smart Irrigation Program – City assisted setup of citizen purchased smart irrigation controller with usage data transmitted to the city.
  4. Dallas West End Kiosks and WiFi – Large kiosks with curated information about tourist sites and wifi connectivity
  5. Oakland Air Pollution Mapping – Mapping pollutant concentration and particulate in the city.

We broke into groups for further discussion of the programs. We then had round robin comments from some of the notable technologies, impact, funding, and other aspects each of the projects, with Q&A from the others.


Prototyping: Considerations From the Breadboard for the Final Product – Notes and Recap

Prototyping: Considerations From the Breadboard for the Final Product

During the introduction, we discussed Cloudflare’s approach for security for IoT devices. During the recent Android Things presentation, we noted that one of its possible advantages was operating system and application updates, enabled by the presumed Play store infrastructure, as a security measure. The Cloudflare approach uses a VPN based approach. A security certificate is deployed to the device so that all communications for the device go through the Cloudflare cloud, enabling ingress/egress filtering. This enables monitoring inbound traffic for attacks and controlling outbound traffic of compromised devices, thus possibly decreasing infection risk and mitigating infection impact.

Next we heard from keynote speaker Dr. Jensen Newman of the UT Dallas Applied Research Center (ARC) on issues to consider during electronics product development for the final product. With his experience, he noted that many issues that arise in development can be resolved by resorting to the product datasheet for the component(s). His presentation continued with suggestions for consideration in five areas:

• Breadboarding – The First Step
• Circuit Design/Schematic Capture
• PCB Design
• Final Assembly
• Design For Manufacture

The presentation included some suggested practices, part numbers, tools, and specifications. Slides are posted here.

Business Issues in IoT Commercialization – Notes and Recap

Business of IoT

Iram Hasan briefly spoke about the UTDesign Capstone program, which allows you to bring the real-world technical projects of your business to UTD senior engineering students’ for their final projects. Each UTDesign team consists of ~ 4-6 senior students working on your proposed project. Students work an average of ~8 hours a week for 1 or 2 semesters. The cost is ~$10k or $15k. For more information, see the website or email Iram Hasan.

We heard from Tony Schuman on R&D tax credit. He provided the NEET mnemonic for the four key requirements.
1. New or improved product or process
2. Elimination of uncertainty
3. Experimentation process
4. Technological in Nature
More details are in the linked slides.

Next, we transitioned to a panel to further discuss commercialization issues in the space:

We heard from panelist Josh Lyon, an IoT Practice lead at L2 Technology Services. He discussed on IIOT implementation where the client extracted hydrocarbons. Unbeknownst to the client, there was a bottleneck in the pipeline, decreasing flow rate. L2 deployed sensors in the pipeline, which helped discover high viscosity at a point in the pipeline. They increased temperature at the bottleneck, which decreased viscosity and increased flow rate, in turn increasing revenue.

We also heard from panelist Adam Lotia , who recently transitioned to Bioworld Merchandising, and is helping the company expand their product line to include IoT based products, including shirts. Adam noted that the value play to Bioworld is not necessarily a recurring revenue but helping it distinguish itself in a crowded market.

We also heard from Noel Geren, a co-founder of Sprinkl, a connected irrigation and conservation technology with a focus on ease of use and conservation. Noel mentioned that part of the market strategy differentiation was going to be cost and ease of use. They would hopefully earn market recognition and add features down the line. The recent coverage in CNET, provides support for this strategy.

Towards the Single-Breath Disease-Diagnosis Breathalyzer – Notes and Recap

Allowing individuals to identify and monitor specific biomarkers of disease in their own breath is one of the anticipated benefits of personalized medicine. Dr. Pelagia Irene Gouma was the keynote speaker and her research group is expected to drive the first products of portable diagnostic breathalyzers. She focused on three issues in doing so:

  1. the sensor’s ability to identify, discriminate, and measure accurately the concentration of the specific metabolite/analyte (such as nitric oxide, carbon monoxide, carbon dioxide, ammonia, acetone, isoprene, benzene, ethane, pentane) in a small volume, complex gas mixture of a single exhalation;
  2. the sensor’s ability to respond fast to the stimulus and to recover fast from it in order to be able to repeat the measurement reproducibly and reliably; and
  3. published guidelines from the medical community for interpreting exhaled gas level.

The first requirement raises the issues of specificity/selectivity to the analyte of interest and sensitivity limits with respect to the lowest detection threshold and the resolution of the response/output signal, which must be measured in the minute concentrations of the important biomarkers in breath (low ppm, ppb, ppt levels). Her group pioneered ceramic nanotechnology based breathalyzers pioneered, relying on a crystallo-chemical approach that relates oxide-gas interactions to the structural features to the analyte of interest as opposed to the composition of the oxide gas sensing element.

UTA Professor Invents Breath Monitor To Detect Flu

Google ‘Android Things’ Operating System Overview – Notes and Recap

February Event

John Lindsay, developer of the Smooth Driver Monitoring Android app presented an overview of the Android Things operating system. He noted that one of the key advantages is an instant comprehensive development ecosystem, as the development environment is Android Studio and integrated functionality such as Firebase, Mobile Vision, and Tensor Flow. One of the noted key disadvantages is the current limited hardware platform support.If you’re familiar with traditional Android development, you’re well on your way to Android Things development, as Android Studio is the IDE and the lifecycle of apps are similar. Programmatically, one generally uses the PeripheralManagerService class to get a handle to a peripheral to then start reading and setting values.
The presentation concluded with demonstrations which were the same or minor modifications from the Android Things samples.

What Is Android Things?

Android Things Tutorials Getting Started

Writing Your First Driver

Curated Useful Android Things Links

Minimizing Contagion Spread with Temperature and Humidity Sensing Algorithms: Notes and Recap

January Event

Samir Rahi is a co-founder of SkinAware, a UTD team which recent won the UTD business idea competition. They seek to improve skin based allergy testing by developing a miniaturized, flexible, bioelectronic device. Their test is derived from UTD faculty created tech that combines nanoliter dosages of allergens (versus the current milliliter dosages) delivered through a patterned microneedle array embedded on a flexible bioelectronic along with temperature sensors capable of measuring thermal fluctuations down to 1/100th of a degree. The end result is a bandaid sized test that quantitatively determines a patient’s allergic response by measuring changes in skin temperature correlated with allergic reaction.

The company is seeking advisors and mentors to assist with FDA and other regulatory consulting as well as with developing a backend connection between the device and the visual display that will show the patient’s results/ If you can help or are interested in learning more, please contact Samir at Samir.RahiPrevent@Spamutdallas.edu.

Rik Heller of Wello then spoke about airborne contagion spread models, where droplets of pathogens are expelled into the air due to coughing, sneezing, or talking. Using influenza, SARS, and other case studies, he discussed observed conditions of contagion spread, with one example being a peak of influenza around New Years. He noted two aspects of airborne contagion spread. The first was a correlation between infectivity and humidity. The second was based on the SARS case studies where ~10% (“superspreaders”) infected ~90% of those eventually infected. He concluded in presenting how the Wello Station seeks to limit “superspreaders” by periodic temperature scanning for febrility in a workplace, hospital, or other focal point. He also presented how Wello Watch seeks to limit the second aspect by monitoring humidity and providing notification of spread and susceptibility risk conditions.


Driver Behavior to Connected Vehicle to a Smart City, A Development Hodgepodge – Notes and Recap

December Event

The discussion started with the recent V2I demonstration in Frisco. The time to green feature was demonstrated where a driver at a red light receives a countdown timer to the green light. Future features will be the reduced speed recommendation, where signals are sent to the vehicle for optimum speed between traffic signals without the need for stopping. Currently, the applications are certain only for late 2016 and 2017 Audis with the traffic light information service. However, from the diagram in the linked article, it appears that there aren’t technical limitations on other models eventually using the system. Frisco expects the system to go live in early 2017

John Lindsay discussed the beta of his Smooth Driver Monitoring app, which monitors driver behavior for sudden stops using the accelerometer and GPS data. The location of the sudden stop are logged and displayed to the user as they drive. Over time, clusters of sudden stops may be formed. This display encourages drivers to change their driving behavior in those locations and average their speed through the location. The app is native Android. See the prior Accessing Sensors in Android Development slides (PDF).

Shayne O’Sullivan discussed the Vinli hardware and software. The hardware aspect of Vinli is a dongle that plugs in the OBD port of the vehicle. The dongle adds 4G LTE connectivity to the vehicle for passengers as as outbound transport of OBD data. The dongle also includes an accelerometer and GPS. The data provides the basis for the Vinli app development environment, which is the largest app ecosystem for cars. The raw OBD, accelerometer, and GPS data are uploaded for controlled access by apps. The Vinli platform provides categorized access to the raw data and provides access to some basic analytics on the raw data. The access is generally RESTful and has wrappers for web socket, Android, and iOS access. See the Vinli developer portal or the developer docs.

Brandon Swink discussed using the IBM Bluemix for a smarter city’s use of aggregate driver data in order to aid increased proactive traffic management/communications. He discussed processing individual vehicle data such as that output by the Smooth Driver App and other individual vehicle data using tools such as IBM Streaming Analytics Services (PDF slides), individually or in aggregate. IBM Streaming Analytics enables a developer to receive and process large volumes of data with low latency. The demo include receiving data that was processed to detect an accident condition for a vehicle. A geofence was created around the accident vehicle for signaling for use by city staff such as traffic or EMS. See the Connected Car Bluemix demo environment.

Jimmy Smerud from Forgerock discussed security issues in a vehicle and connected vehicle setting. He started with the different roles in vehicle access and use such as adult drivers, teen drivers, mechanics, and valets . Following that was discussion of a reference connected device architecture where security can be applied. See the presentation slides (PDF) or the  video of Forgerock Authenticator integration.

Wearable Sensor Systems for Glucose, Cortisol, & Alcohol Consumption Monitoring – Notes and Recap

November Event

Thomas Amlee briefly spoke about the upcoming IEEE Engineer in Residence (EiR) volunteer program, launching in early 2017. EiR brings engineer volunteers to UT Dallas to share industry knowledge and experience with students. Volunteers hold “office hours” for at least 6 hours a month to mentor engineering and computer science students by providing technical advice, career guidance, and opportunities to work on projects. For questions about the program, you can email  eir@utdallas.edu. To become an Engineer in Resident Volunteer, you can sign up at https://goo.gl/forms/4RmVR1aqjB076ynV2

Iram Hasan briefly spoke about the UTDesign Capstone program, which brings the real-world technical projects of your business to UTD senior engineering students’ for their final projects. Each UTDesign team consists of ~ 4-6 senior students working on your proposed project. Students work an average of ~8 hours a week for 1 or 2 semesters. The cost is ~$10k or $15k. UTDesign teams are available for computer science/electrical engineering/biomedical engineering projects starting in January, 2017. For more information, see the website or email Iram Hasan.


The keynote speaker was Shalini Prasad who spoke about wearable sensor systems for glucose, cortisol, and alcohol consumption monitoring from sweat. The glucose monitoring aspects were recently featured. She started the discussion with some deficiencies in optical detection, such as selectivity and quantifying. She also spoke of the necessary sensitivity, with sample sweat volumes being in monitoring and in the range of a microliter and molecule concentrations in the range of microliters per milliliter. She also spoke about measuring metabolites instead of directly measuring glucose, cortisol, or alcohol in order to minimize interference. Some relevant publications from the lab are:

Wearable cortisol biosensor (Flexible nanoporous tunable electrical double layer biosensors for sweat diagnostics)
Wearable alcohol lifestyle monitoring biosensor ( Wearable biochemical sensor for monitoring alcohol consumption lifestyle … )
Wearable cardiovascular health monitor ( Ultrasensitive and low-volume point-of-care diagnostics on flexible strips … )
Wearable glucose biosensor ( Lancet-free and label-free diagnostics of glucose in sweat … )

Wireless Medical Sensor Systems – Notes and Recap

October Forum

We started the discussion with the recent large-scale DDOS attack, which was the largest DDOS attack recorded by Akamai (in terms of bandwidth). The botnet  included more than 150,000 connected devices, including IoT devices. The primary vector was hardcoded passwords in the devices. Within a couple of weeks, source code for the attack was published on github. On a related note, Akamai recently estimated that IoT devices accounted for ~ 20% of attack vectors in 2015, thus it’s important to consider safeguards against this in IoT product development.

The event continued with keynote speaker Professor J.C. Chiao of UT Arlington. The presentation focused on integrated wireless medical sensor systems. In looking at his list of publications, you’ll notice that the systems address issues in biocompatibility, power, RF transmission, and signal processing.

For example, the earlier part of the presentation focused on chronic pain management. One of the goals of the systems was to remove the subjective element of measuring “pain.” To do so, the systems capture the waveforms of a patient when the patient is in normal condition and when the patient is experiencing pain. Later, when the patient is being monitored, the sensor output is compared to the stored waveforms in order to recognize the pain signals.

You can contact J.C. Chiao to request the presentation slides or with other inquiries.

DFW Sensor Bytes – Local Tech News

ParkHub, a parking payment systems and logistics company, integrates NWave’s parking spot sensor into its upcoming American Airlines Center deployment.

John Lindsay releases the Smooth Ride beta, an Android app that uses a phone’s accelerometer and GPS to detect and map the positions of sudden stops in order to encourage drivers to average their speed through places where there are clusters of sudden stops.