
Is observation of electrical discharge possible?
Electrical discharge, i.e. a jump of electric charge (electrons) from a high potential electrode to a low potential electrode. The condition for the development of the discharge to exceed the limit of electrical strength in a given insulation medium (gas, liquid). When the electrons coming out of the HV electrode link with the grounded electrode, the strong spark, and the accompanying characteristic sound are observed. This moment of the discharge is easily noticeable through the phenomena that occur during it, but is it possible to observe the development process of the discharge before the breakdown? When the discharge develops, the strong electric field stimulates the air particles (e.g. nitrogen, oxygen), when the particles are sufficiently ionized, the emission of electromagnetic radiation occurs (an example of the spectrum of radiation of nitrogen and oxygen particles is shown in Fig. 1), while the breakdown occurs the energy of the particles is so large that it seems that the light coming from the discharge channel is white entering the shade of blue. This blue shade also means the creation of ultraviolet radiation (with a wavelength less than 400 nm). Observation of this area of electromagnetic waves enables the registration of pre-discharge processes.

Fig. 1: (a) Radiation emission spectrum of the ionized nitrogen molecule b) Radiation emission spectrum of the ionized oxygen molecule. X-axis scale: wavelength in nm. Source: https://www.itp.uni-hannover.de/fileadmin/arbeitsgruppen/zawischa/static_html/atoms.html
A burning electric arc, after creating a short circuit between the electrodes, will emit visible radiation until the voltage maintaining the arc’s burning does not fall below the value for which the energy accumulated in the arc will allow it to self-extinguish. However, the development of the discharge leading to a short circuit between the electrodes can take several microseconds, image recording for such short snapshots requires the use of specialized equipment in the form of ultra-high-speed cameras additionally equipped with image intensifiers to capture the movement of individual photons. There are a number of solutions from various manufacturers on the market that usually offer cameras with speeds up to tens of thousands of frames per second, unfortunately, the downside to using such cameras is low quality for high speeds and a decrease in the sensitivity of the exposure. In order to check the possibility of registering such a sophisticated event as the development of discharge, a camera of the INVISIBLE VISION Ultra UHSi 12/24 model was used. This camera has the ability to record images at speeds up to 200 million frames per second is the recording of one frame every 5 ns, the light travels the distance of 1.5 m during this time. The image resolution regardless of the frame acquisition speed can be up to 1000×860 px this level is sufficient for the analysis obtained image. One of the disadvantages of using such a camera is the limited recording length of 12 frames and issues associated with the design of the electronic shutter. Despite the low number of frames, the correct setting the camera allows complete observation of the discharge development process. This camera was also equipped with a PiV 16-40MiV image intensifier and a filter that cuts out visible light and transmits UV rays. The test system for observing pre-puncture phenomena was the needle-grounded plate system, i.e. the system of electrodes with the largest field unevenness coefficient in which strongly ionized gas particles appear. The experiment was conducted in the New Technologies Laboratory in Electrical Power Engineering at the Faculty of Electrical Engineering, Computer Control and Biomedical Engineering at AGH. Figure 2 shows the view of the laboratory stand. The system used the GUN400 surge voltage generator from Haefely. This generator enables the generation of lightning and switching impulse voltages with a maximum value of up to 400 kV. The high-voltage lead-out of the generator was connected to the needle (right electrode Fig. 2) and the ground was connected to the plate (left electrode Fig. 2).
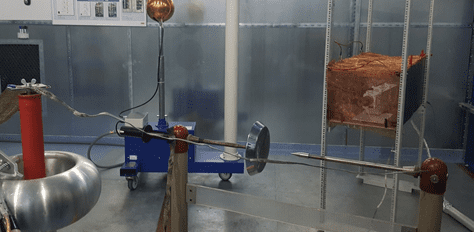
Fig. 2. General view of the setup, needle-plate electrode arrangement visible in the foreground, in the background a camera in a smaller Faraday cage preventing EMF interference
An example of recording one frame just before the discharge is shown in Figure 3, in addition, for better analysis of the mechanism of the development of discharge, the locations of the electrodes, needle and grounded plate were marked.
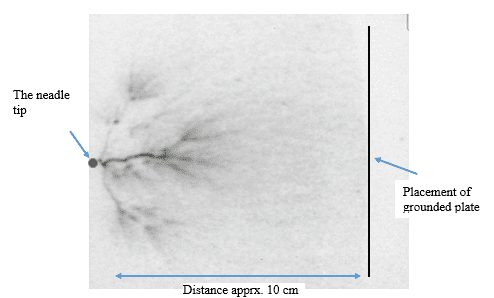
Fig. 3 Example image recorded with a camera before full discharge, 190 kV voltage set, positive polarization,
The development of the discharge (Fig. 3) resembles a tree structure with a noticeable strong main discharge channel and additional corona discharges spreading to all sides. An example of time-lapse recording of the discharge sequence is shown in Figure 4. The camera was set to 12 frames acquisition mode, each was recorded every 50 ns giving a recording speed of 20 million frames per second. The matrix exposure time was also set to 50 ns.

Fig. 4 Development of the discharge with registration of the onset of complete discharge, filming speed 20 M fps, exposure time 50 ns, U = +300 kV
Analysis of the results presented in individual frames shows the occurrence of various forms of discharge during its development. The discharge visible as glow begins only from frame 5, in the 2 previous frames you can see weak corona discharge around which streamer discharges begin to form. You can see that the speed of discharge development is not constant, the increase in the number of streamers increases with the development of the discharge. It can also be seen that to the very end it is impossible to distinguish the path chosen by the main discharge channel so as to connect to a grounded electrode and lead to a complete discharge. Below is a time-lapse sequence of discharge development.
Fig. 5 Sequence after a cage discharge with recording of the onset of complete discharge (last frame), filming speed 20 M frames / s, exposure time 50 ns, U = +300 kV
Registration of phenomena occurring during discharges is important to fully understand the problems of physical mechanisms accompanying this phenomenon. Due to the specificity of the phenomenon associated with short development times and initial low energy processes, it is necessary to use the latest available image recording technologies.
In order to further explore the subject of development and observation of discharge in gases and liquids, we invite you to read the following articles:
Paweł Rózga : Wyładowania elektryczne w układzie elektrod ostrze-izolowana płyta w wybranych cieczach dielektrycznych przy wysokim napięciu udarowym piorunowym http://pe.org.pl/abstract_pl.php?nid=10135
Pawel Rozga, Streamer Propagation and Breakdown in a Very Small Point-Insulating Plate Gap in Mineral Oil and Ester Liquids at Positive Lightning Impulse Voltage https://www.mdpi.com/1996-1073/9/6/467
Maciej Kuniewski , Paweł Zydroń , Wojciech Konieczny , Mark Riches, Zastosowanie bardzo szybkiej kamery UV dla obserwacji rozwoju wyładowań elektrycznych w układzie elektrod ostrze-płaszczyzna http://pe.org.pl/abstract_pl.php?nid=11293